Updated 2 September 2026: the analysis below is built on the release for the twelve months ending 31 March 2026, and a newer release is now out. The figures for the year ending 30 June 2026 — plus two cuts this page did not have — are in the June update at the foot of this page.
This page is built from data pulled and processed here rather than from figures repeated off other sites. The source is Table F-2 of the U.S. Courts bankruptcy statistics — every bankruptcy filed in the twelve months ending 31 March 2026, broken out by federal judicial district and by chapter. I downloaded the official release, extracted the table and computed one thing from it: what share of filings in each district are Chapter 13 rather than Chapter 7.
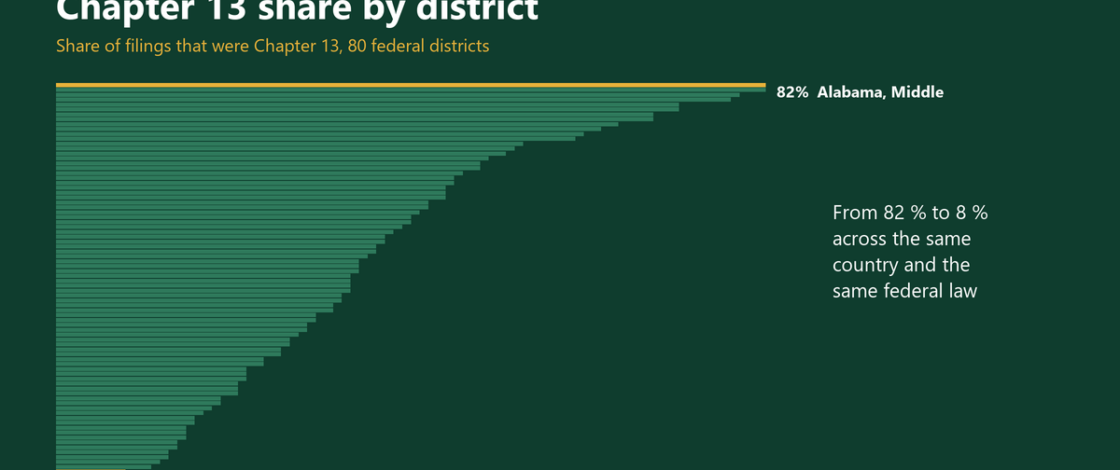
The answer is not a national number, and that is the point. Nationally, 36% of the 591,850 bankruptcies filed in that period were Chapter 13. But in Alabama, Middle District it was 82%, and in Idaho it was 8%. Two people with the same finances, filing in different districts, meet very different local practice.
Why this matters more than it sounds
Chapter 7 discharges qualifying debt in a matter of months and can require giving up non-exempt property. Chapter 13 is a repayment plan that runs for years and lets you keep property by paying for it over time. Which one fits you is supposed to be decided by your income, your assets and your goals. The comparison itself is here: Chapter 7 vs Chapter 13.
What this data shows is that geography is doing some of that work too. The spread between the highest and lowest districts is far too wide to be explained by the finances of the people who happen to live there. Local legal culture, how the trustees in a district operate, and what the attorneys in that courthouse routinely file all leave a mark on the numbers.
I am not going to tell you which chapter to file, and this is not legal advice. What I can tell you is that if a local attorney says “we usually do Chapter 13 here”, that can be literally true of the district and still not be true of you. The tables below tell you which of the two you are hearing. And the income test that decides eligibility for one of them: the Chapter 7 means test.
The fifteen districts most weighted toward Chapter 13
Districts with at least 1,000 filings in the period, so a percentage means something. Codes follow the court’s own notation: two-letter state, then N, S, E, W, M or C for the Northern, Southern, Eastern, Western, Middle or Central district. A bare two-letter code means the state has one bankruptcy court. Arkansas is the case worth knowing about: the source reports it as a single row, AR, because one bankruptcy court serves both the Eastern and the Western District. If you are looking for AR,E or AR,W, they are not separate lines in this release and they are not separate lines here.
| # | Code | District | All filings | Chapter 7 | Chapter 13 | Ch.13 share |
|---|---|---|---|---|---|---|
| 1 | AL,M | Alabama, Middle District | 6,574 | 1,144 | 5,408 | 82% |
| 2 | GA,S | Georgia, Southern District | 3,970 | 701 | 3,250 | 82% |
| 3 | LA,W | Louisiana, Western District | 5,904 | 1,165 | 4,684 | 79% |
| 4 | AL,S | Alabama, Southern District | 4,082 | 893 | 3,164 | 78% |
| 5 | TN,W | Tennessee, Western District | 8,859 | 2,406 | 6,406 | 72% |
| 6 | NC,E | North Carolina, Eastern District | 5,545 | 1,437 | 4,006 | 72% |
| 7 | LA,E | Louisiana, Eastern District | 3,284 | 801 | 2,267 | 69% |
| 8 | GA,M | Georgia, Middle District | 6,724 | 2,044 | 4,636 | 69% |
| 9 | SC | South Carolina | 5,410 | 1,884 | 3,493 | 65% |
| 10 | PR | Puerto Rico | 6,072 | 2,153 | 3,835 | 63% |
| 11 | MS,N | Mississippi, Northern District | 4,545 | 1,726 | 2,782 | 61% |
| 12 | AL,N | Alabama, Northern District | 10,509 | 4,182 | 6,270 | 60% |
| 13 | AR | Arkansas, Eastern and Western Districts (one court) | 7,241 | 3,089 | 4,053 | 56% |
| 14 | KY,W | Kentucky, Western District | 6,154 | 2,808 | 3,331 | 54% |
| 15 | NC,W | North Carolina, Western District | 2,676 | 1,215 | 1,418 | 53% |
And the fifteen most weighted toward Chapter 7
| # | Code | District | All filings | Chapter 7 | Chapter 13 | Ch.13 share |
|---|---|---|---|---|---|---|
| 67 | IA,S | Iowa, Southern District | 2,272 | 1,827 | 424 | 19% |
| 68 | OH,N | Ohio, Northern District | 14,499 | 11,865 | 2,595 | 18% |
| 69 | CO | Colorado | 8,991 | 7,290 | 1,561 | 17% |
| 70 | AZ | Arizona | 13,265 | 10,963 | 2,165 | 16% |
| 71 | NV | Nevada | 9,666 | 8,029 | 1,528 | 16% |
| 72 | CT | Connecticut | 3,660 | 3,077 | 551 | 15% |
| 73 | WV,S | West Virginia, Southern District | 1,032 | 863 | 151 | 15% |
| 74 | WA,E | Washington, Eastern District | 2,343 | 1,973 | 342 | 15% |
| 75 | IA,N | Iowa, Northern District | 1,427 | 1,208 | 203 | 14% |
| 76 | CA,C | California, Central District | 30,913 | 26,133 | 4,355 | 14% |
| 77 | NM | New Mexico | 1,691 | 1,454 | 224 | 13% |
| 78 | CA,S | California, Southern District | 5,660 | 4,900 | 712 | 13% |
| 79 | OK,E | Oklahoma, Eastern District | 1,338 | 1,179 | 154 | 12% |
| 80 | OK,N | Oklahoma, Northern District | 2,067 | 1,831 | 231 | 11% |
| 81 | ID | Idaho | 2,517 | 2,311 | 189 | 8% |
What I take from the numbers
The national average is close to useless as a guide to your own district. The median district in this set files 34% Chapter 13, but the range runs from 8% to 82%. An article that tells you “most people file Chapter 7” is describing the country, not the courthouse you will be standing in. If a plan is already running and stops being affordable: when you cannot finish a Chapter 13 plan.
The concentration is regional, and you can see it without any statistics. Read down the first table and the southern districts cluster at the top. Read the second and the pattern reverses. This is well known among practitioners and almost never mentioned in consumer guides — including, until today, this one.
A high Chapter 13 share is not automatically good news for filers. A repayment plan that runs for years has a completion rate, and a plan that fails can leave someone worse off than if they had filed Chapter 7 at the start. This release does not carry district-level completion data, so I am not going to draw that conclusion from these numbers — but it is the question I would want answered before accepting “we usually do Chapter 13 here”.
Every district with at least 1,000 filings
| # | Code | District | All filings | Chapter 7 | Chapter 13 | Ch.13 share |
|---|---|---|---|---|---|---|
| 1 | AL,M | Alabama, Middle District | 6,574 | 1,144 | 5,408 | 82% |
| 2 | GA,S | Georgia, Southern District | 3,970 | 701 | 3,250 | 82% |
| 3 | LA,W | Louisiana, Western District | 5,904 | 1,165 | 4,684 | 79% |
| 4 | AL,S | Alabama, Southern District | 4,082 | 893 | 3,164 | 78% |
| 5 | TN,W | Tennessee, Western District | 8,859 | 2,406 | 6,406 | 72% |
| 6 | NC,E | North Carolina, Eastern District | 5,545 | 1,437 | 4,006 | 72% |
| 7 | LA,E | Louisiana, Eastern District | 3,284 | 801 | 2,267 | 69% |
| 8 | GA,M | Georgia, Middle District | 6,724 | 2,044 | 4,636 | 69% |
| 9 | SC | South Carolina | 5,410 | 1,884 | 3,493 | 65% |
| 10 | PR | Puerto Rico | 6,072 | 2,153 | 3,835 | 63% |
| 11 | MS,N | Mississippi, Northern District | 4,545 | 1,726 | 2,782 | 61% |
| 12 | AL,N | Alabama, Northern District | 10,509 | 4,182 | 6,270 | 60% |
| 13 | AR | Arkansas, Eastern and Western Districts (one court) | 7,241 | 3,089 | 4,053 | 56% |
| 14 | KY,W | Kentucky, Western District | 6,154 | 2,808 | 3,331 | 54% |
| 15 | NC,W | North Carolina, Western District | 2,676 | 1,215 | 1,418 | 53% |
| 16 | NC,M | North Carolina, Middle District | 2,199 | 1,042 | 1,149 | 52% |
| 17 | LA,M | Louisiana, Middle District | 1,237 | 592 | 623 | 50% |
| 18 | PA,E | Pennsylvania, Eastern District | 5,411 | 2,644 | 2,670 | 49% |
| 19 | MO,W | Missouri, Western District | 4,621 | 2,330 | 2,256 | 49% |
| 20 | MS,S | Mississippi, Southern District | 5,454 | 2,863 | 2,568 | 47% |
| 21 | PA,M | Pennsylvania, Middle District | 3,765 | 1,996 | 1,735 | 46% |
| 22 | TN,E | Tennessee, Eastern District | 7,528 | 4,056 | 3,427 | 46% |
| 23 | KS | Kansas | 4,377 | 2,321 | 1,982 | 45% |
| 24 | TN,M | Tennessee, Middle District | 5,683 | 3,028 | 2,573 | 45% |
| 25 | IN,S | Indiana, Southern District | 11,317 | 6,219 | 5,042 | 45% |
| 26 | GA,N | Georgia, Northern District | 22,051 | 12,229 | 9,493 | 43% |
| 27 | IL,N | Illinois, Northern District | 22,750 | 12,831 | 9,701 | 43% |
| 28 | IN,N | Indiana, Northern District | 7,160 | 4,117 | 3,015 | 42% |
| 29 | FL,S | Florida, Southern District | 16,326 | 9,167 | 6,769 | 41% |
| 30 | IL,S | Illinois, Southern District | 1,845 | 1,067 | 755 | 41% |
| 31 | VA,E | Virginia, Eastern District | 12,734 | 7,565 | 5,092 | 40% |
| 32 | MO,E | Missouri, Eastern District | 6,431 | 3,925 | 2,478 | 39% |
| 33 | TX,E | Texas, Eastern District | 6,423 | 3,872 | 2,460 | 38% |
| 34 | HI | Hawaii | 1,189 | 724 | 448 | 38% |
| 35 | WI,E | Wisconsin, Eastern District | 7,459 | 4,652 | 2,768 | 37% |
| 36 | VA,W | Virginia, Western District | 3,721 | 2,327 | 1,371 | 37% |
| 37 | MD | Maryland | 13,096 | 8,260 | 4,717 | 36% |
| 38 | KY,E | Kentucky, Eastern District | 6,095 | 3,929 | 2,154 | 35% |
| 39 | NJ | New Jersey | 14,388 | 8,679 | 5,068 | 35% |
| 40 | PA,W | Pennsylvania, Western District | 4,968 | 3,129 | 1,735 | 35% |
| 41 | TX,N | Texas, Northern District | 13,407 | 7,831 | 4,560 | 34% |
| 42 | TX,S | Texas, Southern District | 11,651 | 6,349 | 3,912 | 34% |
| 43 | UT | Utah | 7,980 | 5,272 | 2,674 | 34% |
| 44 | NY,W | New York, Western District | 2,519 | 1,649 | 844 | 34% |
| 45 | NY,E | New York, Eastern District | 11,238 | 6,953 | 3,711 | 33% |
| 46 | NE | Nebraska | 2,977 | 1,950 | 977 | 33% |
| 47 | MI,W | Michigan, Western District | 4,033 | 2,725 | 1,301 | 32% |
| 48 | MI,E | Michigan, Eastern District | 18,956 | 12,849 | 6,024 | 32% |
| 49 | TX,W | Texas, Western District | 8,654 | 5,902 | 2,609 | 30% |
| 50 | MA | Massachusetts | 5,231 | 3,551 | 1,565 | 30% |
| 51 | OH,S | Ohio, Southern District | 12,127 | 8,536 | 3,551 | 29% |
| 52 | CA,N | California, Northern District | 6,694 | 4,539 | 1,951 | 29% |
| 53 | WI,W | Wisconsin, Western District | 2,804 | 1,997 | 777 | 28% |
| 54 | NH | New Hampshire | 1,006 | 719 | 272 | 27% |
| 55 | DE | Delaware | 2,169 | 1,120 | 585 | 27% |
| 56 | NY,N | New York, Northern District | 3,905 | 2,828 | 1,033 | 26% |
| 57 | IL,C | Illinois, Central District | 2,797 | 2,051 | 729 | 26% |
| 58 | RI | Rhode Island | 1,107 | 828 | 266 | 24% |
| 59 | NY,S | New York, Southern District | 5,768 | 3,942 | 1,357 | 24% |
| 60 | MN | Minnesota | 10,515 | 8,096 | 2,358 | 22% |
| 61 | WA,W | Washington, Western District | 7,412 | 5,706 | 1,610 | 22% |
| 62 | FL,N | Florida, Northern District | 2,758 | 2,083 | 598 | 22% |
| 63 | OR | Oregon | 8,249 | 6,471 | 1,736 | 21% |
| 64 | OK,W | Oklahoma, Western District | 4,313 | 3,388 | 907 | 21% |
| 65 | FL,M | Florida, Middle District | 27,925 | 21,563 | 5,821 | 21% |
| 66 | CA,E | California, Eastern District | 12,914 | 10,308 | 2,494 | 19% |
| 67 | IA,S | Iowa, Southern District | 2,272 | 1,827 | 424 | 19% |
| 68 | OH,N | Ohio, Northern District | 14,499 | 11,865 | 2,595 | 18% |
| 69 | CO | Colorado | 8,991 | 7,290 | 1,561 | 17% |
| 70 | AZ | Arizona | 13,265 | 10,963 | 2,165 | 16% |
| 71 | NV | Nevada | 9,666 | 8,029 | 1,528 | 16% |
| 72 | CT | Connecticut | 3,660 | 3,077 | 551 | 15% |
| 73 | WV,S | West Virginia, Southern District | 1,032 | 863 | 151 | 15% |
| 74 | WA,E | Washington, Eastern District | 2,343 | 1,973 | 342 | 15% |
| 75 | IA,N | Iowa, Northern District | 1,427 | 1,208 | 203 | 14% |
| 76 | CA,C | California, Central District | 30,913 | 26,133 | 4,355 | 14% |
| 77 | NM | New Mexico | 1,691 | 1,454 | 224 | 13% |
| 78 | CA,S | California, Southern District | 5,660 | 4,900 | 712 | 13% |
| 79 | OK,E | Oklahoma, Eastern District | 1,338 | 1,179 | 154 | 12% |
| 80 | OK,N | Oklahoma, Northern District | 2,067 | 1,831 | 231 | 11% |
| 81 | ID | Idaho | 2,517 | 2,311 | 189 | 8% |
Method, so you can check it
Source: Table F-2, U.S. Bankruptcy Courts — Business and Nonbusiness Cases Commenced, by Chapter of the Bankruptcy Code, During the 12-Month Period Ending March 31, 2026, published by the Administrative Office of the U.S. Courts. I downloaded the official PDF, extracted the table as text, parsed the district rows and computed the Chapter 13 share as Chapter 13 filings divided by all filings in that district.
Totals for cross-checking against the source: 591,850 filings across all chapters, of which 369,702 Chapter 7, 211,700 Chapter 13 and 9,941 Chapter 11. If your arithmetic on the official table does not match mine, mine is the one to doubt — tell me through the contact page and I will correct it.
One trap worth flagging, because I fell into it. The PDF contains two tables that use the same district codes, one with fourteen numeric columns and one with five. Parsing both and letting the second overwrite the first produced a national Chapter 13 figure of zero — obviously wrong, but only obviously if you check the total against the printed page. I do, and the check is why these numbers are the right ones.
A second trap, which this page fell into and has now been corrected. One row in the source does not carry a district suffix and does carry a footnote marker: Arkansas, printed as AR with a dagger, because a single bankruptcy court serves both the Eastern and the Western District. The first version of this parser dropped that row, so a table that promised every district with at least 1,000 filings quietly omitted a district with 7,241 of them. The totals still cross-checked, because the total line is read straight from the source and never depended on the row surviving the parse — which is exactly why the omission was invisible for so long. Arkansas is now row 13, at 56%.
Two limits. Districts with fewer than 1,000 filings are left out of the tables, because a percentage on a small base moves too much to read; they are in the underlying figures. And these are filings, not outcomes — the table counts cases commenced and says nothing about how many plans completed.
This release updates quarterly. When the next one lands I will rerun the same processing rather than editing numbers by hand, and the date on this page will change.
Sources
- Administrative Office of the U.S. Courts — Bankruptcy Filings Statistics, quarterly release, Table F-2, 12-month period ending 31 March 2026.
- Chapter definitions: 11 U.S.C. Chapters 7 and 13.
Not legal advice. Which chapter fits your situation depends on facts about your income, assets and debts that this table does not contain. PayoffPath does not sell bankruptcy services and takes no referral payment.
The June 2026 table, and what moved since March
This page is rebuilt from the source each quarter rather than edited by hand, and this is the first rebuild. The prose above was written from the release covering the twelve months to March 2026, and its figures are that release’s. The tables and figures below come from the release covering the twelve months to June 2026, which is the current one. Where the two disagree, the June release is the live number and the March figures above are kept as they were rather than quietly overwritten.
What moved. All filings went from 591,850 in the March release to 608,511 in the June one, with Chapter 7 at 382,161 against 369,702 and the plan chapter at 215,490 against 211,700. On exactly the basis the prose above uses — plans as a share of every filing in the table — that is 35.4% in June against 35.8% in March, which the text above rounds to 36%. Plan filings rose in absolute terms and fell slightly as a share, because Chapter 7 rose faster.
The headline figure this page now leads with is a different fraction of the same table, and it is worth being explicit about which is which. 36.9% is the plan chapter’s share of consumer filings only — nonbusiness Chapter 13 over nonbusiness Chapter 7 plus nonbusiness Chapter 13. It is the more useful number for a person choosing between the two chapters, because business filings are not a choice they are making. On that consumer basis the extremes are 82.1% in Alabama’s Middle District and 8.1% in Idaho. The older prose reports 82% and 8% for those same two districts and it is right on its own basis: across all filings in the March release they come to 82.3% and 7.5%. Neither pair contradicts the other and the ordering of the districts is identical. Arkansas is still a single row, now with 7,600 filings and a 58.1% consumer plan share.
The June release also allows a cut this page has never carried: how each district’s total caseload changed against the same twelve months a year earlier, across the 92 district codes present in both releases. The three fastest risers are small courts, where a large percentage is a small number of cases — Alaska at 57.7%, the District of Columbia at 48.8% and North Dakota at 46.9%. The fastest riser of any size is Texas’ Southern District at 38.4%, from 9,016 filings to 12,475, and Florida’s Middle District rose 26.1% on an already very large base. Four rows fell, and the largest decline is Delaware — where much of the country’s corporate bankruptcy is filed, so its line moves with companies rather than with households. That distinction matters more in the next section than it does here.
| Release (12 months to) | All filings | Chapter 7 | Chapter 13 | Chapter 11 | Ch. 13 of all filings | Ch. 13 of consumer filings | Our row sum matches the printed Total? |
|---|---|---|---|---|---|---|---|
| June 2025 | 542,529 | 333,321 | 200,290 | 8,408 | 36.9% | 38.3% | yes |
| March 2026 | 591,850 | 369,702 | 211,700 | 9,941 | 35.8% | 37.2% | yes |
| June 2026 | 608,511 | 382,161 | 215,490 | 10,320 | 35.4% | 36.9% | yes |
How common bankruptcy is per head, and why a state is not a district
The second new cut divides filings by the people who could have filed them. Alabama has the highest rate in the country: 21,688 filings in the year to June 2026, or 420.5 per hundred thousand residents. Alaska has the lowest, at 41.3 per hundred thousand from 306 filings. That is a 10.2-fold difference in how often people in two American states end up in a bankruptcy court, and it is a wider spread than anything in the chapter tables above.
The two cuts are not the same cut, and reading them together is where this page earns its keep. Nevada files at 301.9 per hundred thousand, fourth highest in the country, and puts only 16.3% of its consumer cases into a plan. North Carolina files at 98.8 per hundred thousand, in the bottom quarter, and puts 63.3% of them into a plan. High filing rates do not travel with plan-heavy practice, and a state can be at one extreme on one measure and the opposite on the other. Anyone who has been told that a plan-heavy district is a distressed district can check that claim against these two columns.
One row has to be read with care rather than at face value. Delaware appears at 201.7 filings per hundred thousand, which would put it in the upper half of the table, but only 148.0 of that is consumer filings. The gap is corporate bankruptcy filed in a state where a great many companies are incorporated, and the same caveat applies with less force to New York’s Southern District. A judicial district is not a housing market and it is not a population, which is the limit that governs this whole section. If what you are trying to price is your own case rather than your state, the chapter-specific pages are the ones that help: what a plan bills, line by line and what the shorter chapter costs. Our sourcing and checks for every figure on this site are on the methods page.
| Source | Administrative Office of the United States Courts, Table F-2, U.S. Bankruptcy Courts Business and Nonbusiness Cases Commenced by Chapter of the Bankruptcy Code; population from the U.S. Census Bureau, Vintage 2024 Population Estimates |
|---|---|
| What we asked it | We read the official XLSX releases for the 12-month periods ending June 30, 2026, March 31, 2026 and June 30, 2025 district row by district row, rather than the PDF, which prints two tables with the same district codes. The consumer plan share is nonbusiness Chapter 13 over nonbusiness Chapter 7 plus nonbusiness Chapter 13; the per-head rate aggregates the districts in each state and divides by the Census estimate for 2024 |
| Data as of | Filings for the 12-month period ending June 30, 2026, with the periods ending March 31, 2026 and June 30, 2025 for comparison; population as of the Vintage 2024 estimates |
| Retrieved | September 2, 2026 |
| Assumptions | Every rate on this page is ours; the courts publish counts by chapter and the Census publishes population, and neither publishes a rate; the districts of a state are summed to the state, which is exact for filings and approximate for the people who filed them; population is a 2024 estimate against filings running to mid-2026, so the denominator is about eighteen months older than the numerator; districts with fewer than one hundred consumer cases are excluded from the chapter-share ranking, because a share on that base moves too much to read |
| How to repeat it | Download the F-2 workbook for the period ending June 30, 2026 from the courts’ data-tables page and the Census state totals file, sum the district rows, check that sum against the printed Total row on the release, and only then divide. Repeat with the earlier releases to reproduce the comparison columns |
| State | Population estimate, 2024 | Filings, year to June 2026 | Per hundred thousand residents | Consumer cases filed as Chapter 13 |
|---|---|---|---|---|
| Alabama | 5,157,699 | 21,688 | 420.5 | 69.8% |
| Mississippi | 2,943,045 | 10,368 | 352.3 | 53.7% |
| Tennessee | 7,227,750 | 22,800 | 315.5 | 56.1% |
| Nevada | 3,267,467 | 9,866 | 301.9 | 16.3% |
| Georgia | 11,180,878 | 33,570 | 300.2 | 53.2% |
| Kentucky | 4,588,372 | 12,689 | 276.5 | 44.7% |
| Indiana | 6,924,275 | 18,755 | 270.9 | 43.5% |
| Michigan | 10,140,459 | 23,655 | 233.3 | 31.4% |
| Utah | 3,503,613 | 8,143 | 232.4 | 33.3% |
| Louisiana | 4,597,740 | 10,624 | 231.1 | 74.1% |
| Ohio | 11,883,304 | 27,347 | 230.1 | 22.8% |
| Illinois | 12,710,158 | 27,859 | 219.2 | 40.1% |
| South Dakota | 924,669 | 746 | 80.7 | 20.8% |
| Massachusetts | 7,136,171 | 5,451 | 76.4 | 30.8% |
| New Hampshire | 1,409,032 | 1,064 | 75.5 | 24.7% |
| Vermont | 648,493 | 308 | 47.5 | 23.9% |
| Maine | 1,405,012 | 647 | 46.0 | 21.6% |
| Alaska | 740,133 | 306 | 41.3 | 24.5% |
What this does not say.
- A judicial district is not a state and a state is not a labour market. Delaware and New York’s Southern District carry corporate filings from across the country, so their per-head rates overstate how often people who live there file.
- The population is older than the filings. The Census estimate used is for 2024 and the filings run to the middle of 2026, so a state whose population moved sharply in between has a rate that is slightly wrong in a known direction.
- These are filings, not outcomes. Nothing on this page counts plans confirmed, completed or dismissed, because the release carries no such column. A high plan share is not evidence that plans work in that district, and it never was.
- The table does not say why any district files the way it does. Local practice, what the trustees there expect, and how attorney fees are financed in each chapter are all plausible causes and none of them is measured here.
- This release is quarterly. Every figure below the March prose above will be wrong once the next one lands, and the fix is to rerun the same processing rather than to edit a number by hand.
Frequently asked questions
Which period does this table cover? The twelve months ending June 30, 2026, which is the current release of Table F-2 from the Administrative Office of the U.S. Courts. The prose at the top of the page was written from the previous release, covering the twelve months to March 2026, and its figures are that release’s.
How often is Table F-2 updated? Quarterly. Each release is a rolling twelve-month total rather than a single quarter, so consecutive releases overlap by nine months. This page is rebuilt by rerunning the same processing on the new file rather than by editing numbers by hand.
Why do two different national Chapter 13 shares appear on this page? Because they are two different fractions of the same table. 35.4% is Chapter 13 as a share of every filing, including business cases; 36.9% is its share of consumer filings only, which is the more useful number for someone choosing between the two consumer chapters. Both are our calculations and both are stated with their denominator.
Which state has the most bankruptcies per person? Alabama, at 420.5 filings per hundred thousand residents in the year to June 2026. Alaska has the fewest at 41.3, a more than tenfold difference. The rate is our calculation from the court filing counts and the Census Bureau’s 2024 population estimates.
Does a high Chapter 13 share mean a district is in worse financial shape? The data does not support that reading. Nevada files very often per head and rarely uses a plan; North Carolina files rarely per head and uses a plan in most consumer cases. Filing rates and chapter mix vary independently, so one cannot be read off the other.
Can I check these numbers myself? Yes, and that is the point of the method section. Download the F-2 workbook for the period, sum the district rows, and check your sum against the Total row the courts print on the same page. If your arithmetic disagrees with ours, ours is the one to doubt.
Sources
- Administrative Office of the U.S. Courts — Table F-2, bankruptcy filings by district and chapter, 12-month period ending June 30, 2026 (accessed 2026-09-02)
- Administrative Office of the U.S. Courts — Table F-2, 12-month period ending June 30, 2025, used as the year-earlier comparison (accessed 2026-09-02)
- U.S. Census Bureau — Vintage 2024 state population estimates (NST-EST2024-ALLDATA), column POPESTIMATE2024 (accessed 2026-09-02)
Information, not advice. How we calculate, source and review this — and what we do not do — is set out on our methods and sourcing page.